
The path to success and business development always exists, but it remains blurred.
It is hidden in your data. Data analysis and market research can teach you all the information you need to know about your business, customers, competitors, strategies, and more. By detecting patterns in the data, you can uncover exciting correlations and relationships between metrics and dimensions. These insights have many benefits, which we will discuss in this article. You will also learn how to overcome the challenges of data analysis in marketing research. After all, data is complex and presents many obstacles. If you want to conduct successful market research, you need a roadmap to overcome these obstacles. Let’s dive in.
Understanding Patterns During Marketing Data Analysis
Data analysis has been around long before computers, spreadsheets, databases, and even ancient merchants did basic data analysis in their minds. For example, a restaurant remembers your favorite order or that you are a regular on Tuesdays; that’s a case of data analysis. It’s a pattern.
Patterns have different shapes and sizes. They can be classified into several categories.
Trends
Trends occur when your data steadily increases or decreases. Each data point is slightly higher or lower than the previous one. When you plot the data on a line chart, a steady increase/decrease shows the line rising up or down. This is an example:

In this case, the trend line is rising. However, this doesn’t necessarily mean it’s a positive pattern. If the data being shown is your wasted expenditure, you certainly don’t want it to increase. The same applies to a decreasing trend line.

If this chart shows your cost per acquisition, then a decreasing trend is a good thing. This is why context is crucial in measuring the success of advertising campaigns!
Shifts
When your data changes, there are several data points higher or lower than the norm. Unlike trends, it’s not a steady climb, but a sudden change over several data points. This is an example:

You’ll notice a significant jump from the last blue data point to the first red data point, indicating the beginning of a shift. Daily temperature is a good example of showing the difference between trends and shifts. If the temperature steadily rises (50 degrees, 52 degrees, 55 degrees, 59 degrees, etc.), it’s an example of a trend. If the daily temperature starts in the fifties but there’s a heatwave that causes the temperature to soar and remains in the seventies, that’s an example of a shift.
Outliers
Sometimes, there’s a peak in the data where similar data points don’t follow right after, like an odd one out in a class. When an isolated point is significantly lower or higher than normal, it’s an outlier. In other words, outliers are one-off occurrences. They show up and then disappear. This is an example of an outlier:
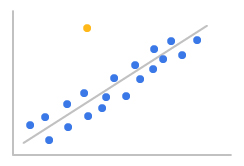
You can see that this peak in the data deviates significantly from the norm. This is a common reason for outliers in data. Outliers can also occur in data because the defined pattern is opposite to what was expected. This is known as inverse correlation.
This often happens in PPC campaigns. For example, if your click-through rate increases, you’d expect your conversion rate to start climbing as well. If the opposite happens (click-through rate increases, but conversion rate decreases), that’s an anomalous pattern.
The Process of Data Analysis and Market Research
How do you detect these patterns in your data? The process of data analysis and market research can be a tricky one. It’s a multi-step activity full of obstacles and potential pitfalls that can sideline your research or yield uninspiring results. By understanding the process, you can better identify these potential obstacles and overcome them without interrupting your data analysis or market research.
Ask the Right Questions
It starts with a question. You conduct data analysis to answer specific questions. For example, you might ask, “What are my most profitable PPC keywords?” This question will guide your entire data analysis process, including the data you collect and analyze. Remember, your time is precious, and market research and data analysis are time-consuming.
If you spend too much time asking the wrong questions, you won’t get actionable results from your data analysis.
So, what makes a question wrong or right in data analysis? Consider the following:
Marketing Objectives: The questions you ask should align with your primary marketing objectives.
Value: You want to ask valuable questions. Typically, businesses define value through metrics like return on investment or profit.
Relevance: Your marketing or business landscape is constantly changing. You want to ask questions that are relevant to your current performance and success.
Collect Your Data
Once you have formulated your analysis question, it’s time to collect data. Again, think about value and relevance. Your marketing activities generate a lot of data, which means you must strategically decide which data to analyze.
Having too much data can confuse your analysis and cause problems in the future. But having too little information will make it challenging to derive actionable results from the research.
Marketing activities involve many different metrics and dimensions. You must critically consider which ones are most relevant to answering your analysis question.
Typically, these are your key performance indicators (KPI), or metrics closely related to your goals. You must also consider the source of the data. You don’t want to utilize data from untrustworthy or unverified sources. This will compromise the accuracy of the analysis results.

Clean the Data
Chances are, you’re collecting data from multiple sources. Before you begin the analysis stage of the process, you must prepare the data. Cleaning the data is a multi-step process in itself. You need to filter, standardize, and validate the information you’re using.
Filters: When you collect data from various sources, you end up with duplicated information. For example, if you’re analyzing click-through rates and conversion rates for PPC ad campaigns, you’ll extract data from both the Google Ads dashboard and the Google Analytics (Analytics) account. This creates duplicate counts that need to be corrected before you begin the analysis.
Standardization: Different datasets will use their labels and measurements for the same data. For instance, if you’re looking at product measurement data, it could be displayed in inches in some cases and in centimeters in others. Standardizing your data means combining different data to read the information as a cohesive set.
Validation: Accuracy is crucial in data analysis. If your data isn’t validated or has errors, it will impact your results. Thus, you must double and triple-check your cleaned data to ensure there are no errors, missing entries, duplicate entries, etc.
Cleaning the data is a time-consuming process with practically no shortcuts available. However, if you want to achieve optimal results at the end of your analysis and market research, you must do it.
Analyze the Data
Finally, your data is ready for analysis. You might expect most of the work to be in your rearview mirror, but unfortunately, that’s not the case. Data analysis is the process of transforming the data you’ve now cleaned and collected into valuable and actionable insights.
To do this, you need to look at the data from many different angles and dimensions. Each new way you view or manipulate the data adds context. Context in the data provides you with the necessary background and knowledge to understand everything happening behind all the numbers, metrics, and figures.
Analysis not only answers what is happening but also why it’s happening and how it affects your marketing and business.
Extract and Apply Insights
At the end of the analysis, you should have some form of solution to your initial question. You may have to analyze data of several different methods and approaches to extract all potential insights before coming to conclusions or results. Your insights should guide you to take some form of action or decision to improve your performance or business growth.
However, making sense of your insights and linking them to defined actions is not always immediately apparent. In some cases, you may not be sure how to take action based on insights and may need to consult with your team.
The Benefits of Data Analysis in Market Research
As you can see, data analysis in marketing research is a rigorous process. Market research is very beneficial, but you need to go through these multiple steps to reap these benefits. So, what exactly are the returns of data analysis in market research? How does data analysis enhance your business in various ways?
Empower Your Marketing
Data analysis shows you what’s going on in your advertising campaigns and how you can improve performance by preventing losses or enhancing returns. As mentioned, data contains valuable information about your strategies, competitors, customers, and more. These are crucial building blocks for successful marketing.
By identifying patterns in marketing analysis, you can discover opportunities and potential risks in your marketing activities. Marketing data analysis enables you to quickly catch these negative or positive events, maximizing the value of every decision you make.
Reducing risks early can minimize potential damages and seizing opportunities early mean you can capitalize faster than your competitors.
Therefore, your analysis speed is everything!
Innovate to Meet Audience Needs
Successful marketing largely depends on your ability to discover and meet customer needs. The challenge is that these interests often change.
Through data analysis and market research, customer interests rise to the surface. This helps you adjust your strategies, messaging, and products based on the latest audience trends.
Essentially, data analysis and market research allow you to actively “listen” to customer feedback and respond to their demands for your brand and products.
These audience insights not only enhance your marketing capabilities but also provide information for your product development.
By understanding your audience, you can produce more relevant and valuable products and services.
Ensure Competitive Gaps and Opportunities
Many of the opportunities and performance changes you discover during data analysis represent market gaps. Gaps occur when what your customers want is underserved in the market.
In other words, a gap is something your customers want but can’t easily find from you or your competitors. It could be a product feature, service, location, promotion, or something else. Through market research and data analysis, you can identify these gaps and capitalize on them accordingly.
For example, when conducting keyword research for PPC ad campaigns, you might notice certain product-focused keywords being searched by your audience. Keywords like “data analysis software with accurate reporting” suggest that users are looking for a product (data analysis software) and a feature (accurate reporting).
If there aren’t competitors actively offering or marketing the accurate reporting feature, that’s a market gap.
Enhance Your Return on Investment
The ultimate outcome of these benefits—better marketing, customer-centric products, competitive agility, accelerated growth—is an improved return on investment. Since return on investment is the ratio of your cost to return, there are two ways to enhance it: Reduce costs or improve results.
Data analysis and market research can address both simultaneously. When you leverage opportunities in the market and fill gaps for customers with more relevant products, your performance improves.
Simultaneously, the data analysis will point out areas of concern in your return on ad spend. These strategies underperforming could be wasting your ad budget.
Once you address the sources of this wasted expenditure, you have more budget to dedicate to strategies that deliver substantial returns.
This budget optimization is crucial for improving your PPC return on investment.
Maximize your Data Analysis Efforts and ROI with PPC Signal
In the pursuit of optimizing marketing strategies, you should also consider the efficiency of your data analysis and market research methods.
The time you invest in data analysis is as valuable as the analysis results themselves. If you can eliminate obstacles and focus on rewards, it will significantly enhance your outcomes.
This is exactly what PPC Signal aims to do for marketers. It automatically generates comprehensive insights, preparing you for action regarding your ad performance.
With AI technology, PPC Signal acts as a 24/7 watchdog for your ad campaigns. This allows you to effortlessly stay on top of every significant change in ad performance.
Let’s take a look.
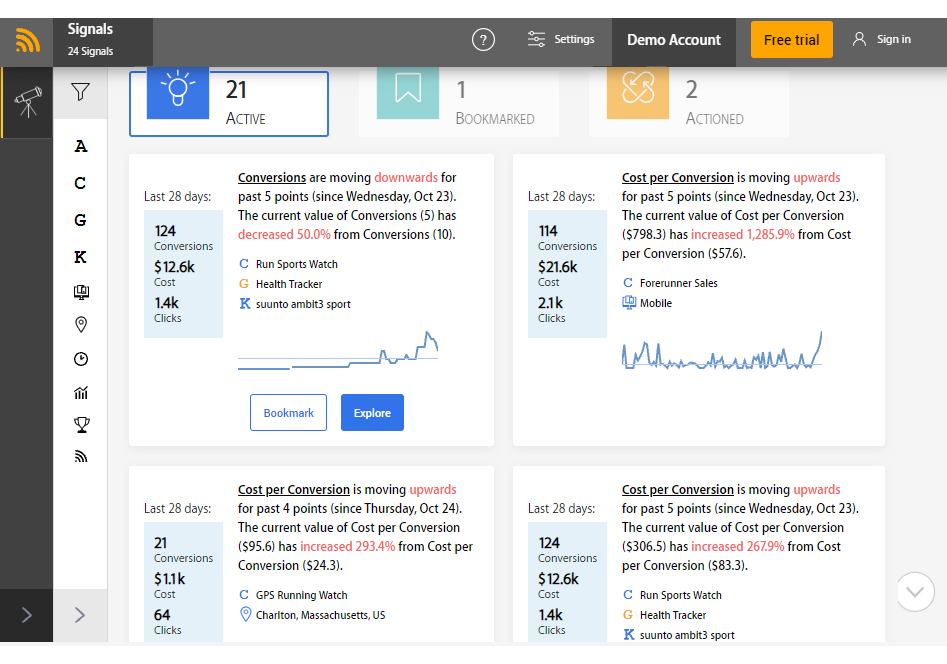
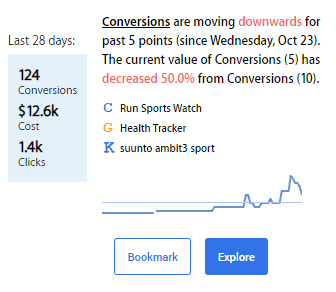
PPC Signal Dashboard
Rather than explain how PPC Signal works, it’s easier to see its actual impact. In this example Google Ads account, there are 21 active signals. You can view the complete list of these signals from the PPC Signal dashboard. You’ll also see sections with bookmarks and action signals. Bookmarked signals are those you leave out for future reference. Action signals are insights you’ve acted upon in the past. Thanks to the PPC Signal system, the action signals serve as a historical account of changes you’ve made to your account in the past.
You can filter signals using the options on the left.
This allows you to weed out any signals that don’t align with your criteria, leaving only the most important ones.
When you find an active signal that piques your interest, you can choose to explore it further.
Explore and Process Signals
By choosing to explore a signal further, you’ll see deeper data views and insights.
Use the Advantages of PPC Signal
PPC Signal isn’t the only marketing data tool available, so what makes it the best PPC optimization tool? It essentially boils down to the tool’s commitment to providing comprehensive, validated insights.
Insights, it can be said, are the entire purpose behind data analysis in market research. Comprehensive insights give you a holistic view of what’s happening behind all the ever-changing figures, allowing you to take action more easily and make wiser decisions.
Many tools promise to offer automated data insights, but they only deliver half. When performance changes, they let you know, but the background information provided is seldom enough to help understand the shift, trend, or other patterns.
PPC Signal provides only comprehensive insights. All the data required for you to understand and take action against changes are packaged and presented in a simple and clear way.
You never have to dig into additional details or analyze the data yourself; PPC Signal takes care of everything.
Your only responsibility is to choose the signals to pursue first and how to handle the insights you explore.
Frequently Asked Questions:
Why is data important?
Data is one of the most crucial resources for modern businesses. Every interaction your business has with its audience generates data. Every success, failure, or in-between process is cataloged and stored as data. While a single interaction might not tell you much about your business, stringing all this data together paints a complete picture of your profitability in the ever-shifting marketplace.
What are the methods of data analysis?
There are many different types of data analysis, including sentiment, text, diagnostic, predictive, prescriptive, and many others. Despite these different methods, the process remains the same: posing a question, collecting data, cleaning data, analyzing data, and extracting insights.
That said, the two main methods of data analysis are manual and automated.
In manual analysis, each step is done by a person (or a group of people). This is a very time-consuming method that may not yield optimal results.
On the automation front, most of the heavy lifting is done by artificial intelligence and machine learning algorithms, with human intervention needed to put the analysis results into practice.
How do you show patterns in data?
The best way to find patterns in a data set is to plot charts or visualize the information. Human brains are much more receptive to visual signals than raw numbers or text (in fact, thousands of times more).
When you see a chart, patterns and correlations almost jump off the page. You can immediately see a visual representation of the data and have a very accurate understanding of everything happening behind all those numbers. The situation isn’t the same when you only have a tabular view of the data.
Wrap Up
Data analysis in marketing research is crucial in today’s competitive business world. Many companies deliver finely-tuned, personalized experiences to every customer based on their data collection, processing, analysis, and action.
This means today’s consumers have ever-higher expectations of activities, products, offers, and brands directly aligned with their interests, preferences, beliefs, and more.
To stay competitive, you need to efficiently manage and interact with data.
In short, you need to transform real-time data into actionable insights that help you improve your business every day.
PPC Signal is the leading Google Ads management solution because it provides insights ready for action based on your current and historical performance.
If you find yourself struggling to pull away from nauseating spreadsheets and continuous fluctuations in ad campaign metrics, PPC Signal is the solution you’ve been waiting for.
Simplify your data analysis process and amplify your results!